When you repeat an experiment over and over and add the results, the probability distributions change in an interesting way.
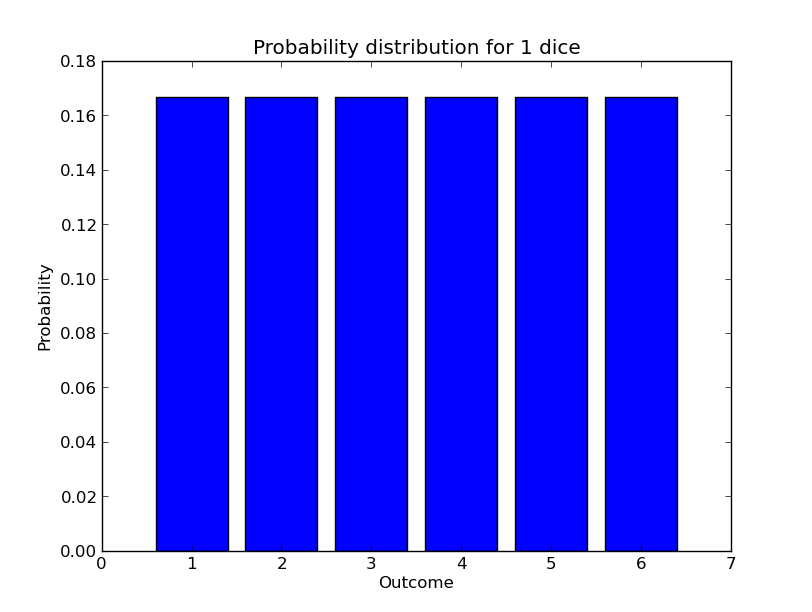
This distribution doesn’t look anything like a bell curve, but it does have a mean () and a standard deviation ():
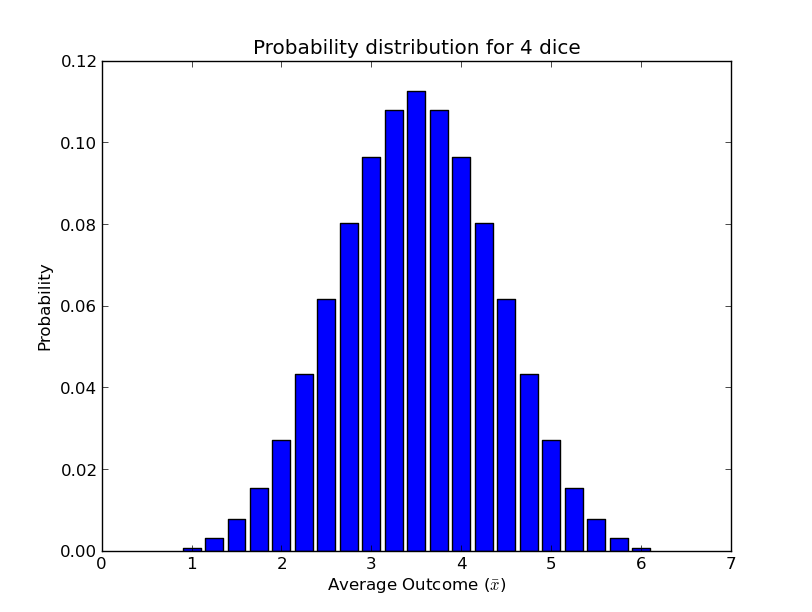
Now we have something that looks a lot like a bell curve. Here are the mean and standard deviations for .
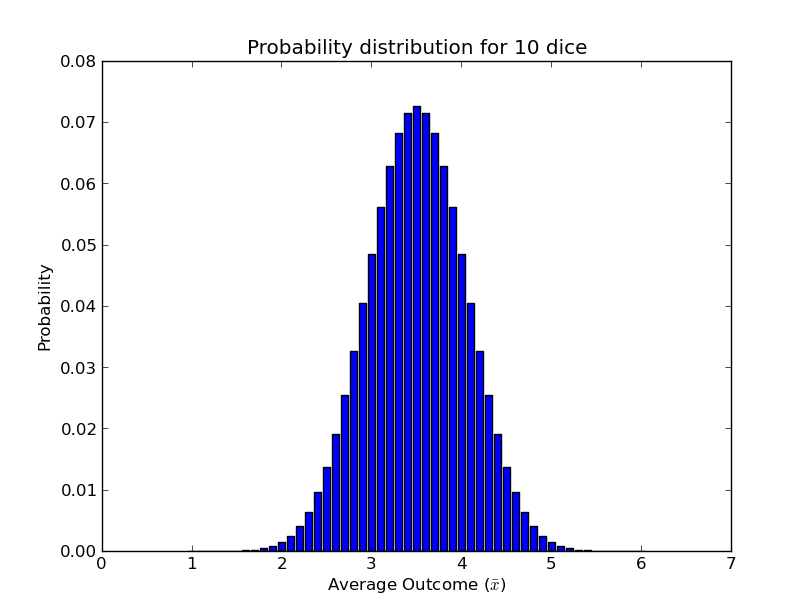
Notice that the middle hasn’t changed, but the results are only half as spread out.
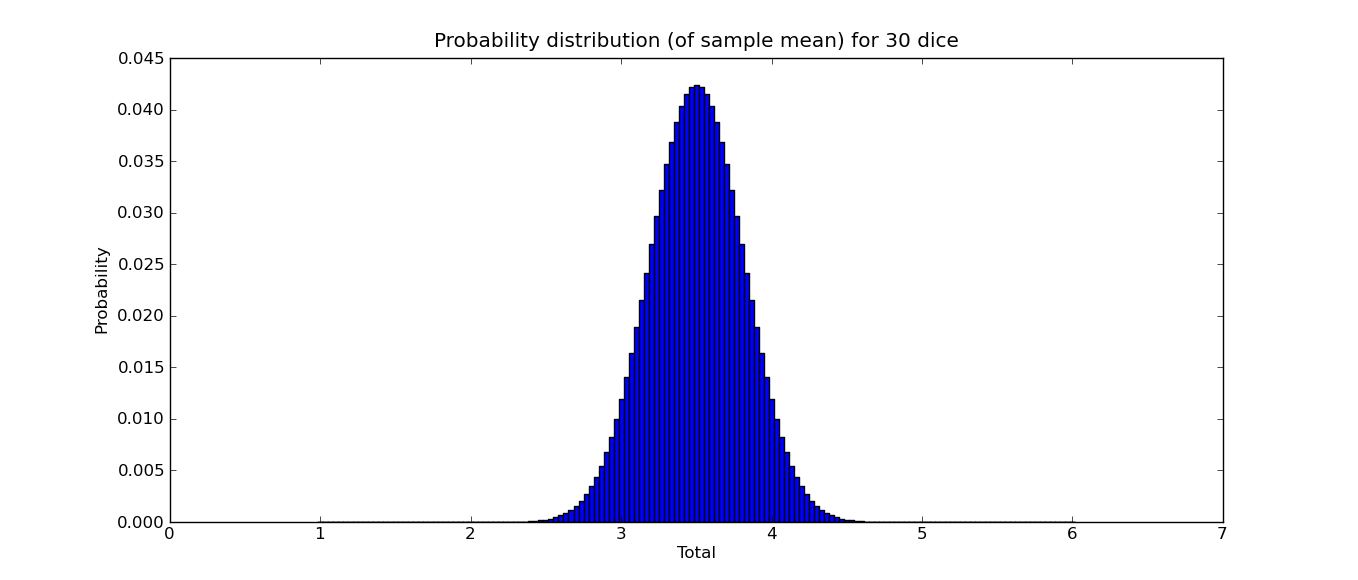
Calculate and for the average result of 30 dice.