The slope, y-intercept, and predicted average y-values of a linear regression model are all statistics calculated from samples. Sample statistics are subject to sampling error in the form of bias and random error. Statistical inference lets us estimate the random error in a statistic.
We can make a confidence interval for the slope of a least squares regression model \(y=mx+b\). The critical t-value \(t^*\) has \(n-2\) degrees of freedom in this situation. The formula below is interactive. Click on it to enter your numbers.
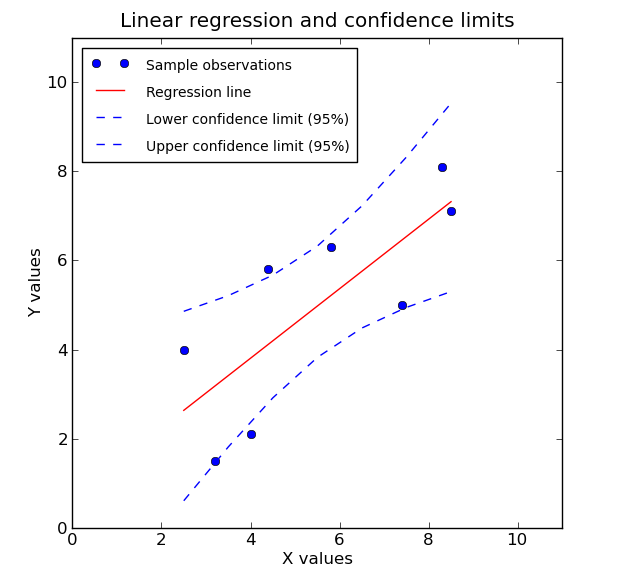
\[m \pm t^* \frac{m \sqrt{1-r^2}}{r\sqrt{n-2}}\]There are also confidence interval formulas for the y-intercept and for the average y-value at any one x-value. We won’t cover those in this class. But in the future you might see pictures like this that show a regression line, along with two curves that show where we can be 95% certain the true average y-values will fall.
Here the (red) linear regression line is our best guess for the average y-values at different x-values. Since it is based on sample data, we also have a margin of error that stretches above and below the best guess. Notice that the uncertainty gets larger as we get farther from the average x-value.