![]()
|
|
|
LAB 4-5
ACTIVATION OF MUSCLE PROTEIN GENES DURING ZEBRAFISH DEVELOPMENT
I. Introduction The more one studies development, the more amazing it seems that embryos actually develop. Consider that virtually all nucleated animal cells contain all the information that is necessary to make a complete new organism. During early development genes in the zygote are activated, protein product is produced and the embryo grows, divides and differentiates. In the next few labs we are going to look at aspects of this process of gene activation during development in the zebrafish.Actins and myosins are classes of proteins that are present in most cells, but they are present in very high concentrations in differentiated muscle cells. At some point during development genes in mesodermal cell lineages start to express muscle-type mRNA’s and hence muscle type proteins. We are going to try to visualize the first appearance of muscle proteins using SDS-PAGE gel electrophoresis.A. Background on SDS-PAGEAs you know, gel electrophoresis is a powerful tool for separating and visualizing biological macromolecules. You have performed agarose gel electrophoresis to separate nucleic acids. In this experiment, you will use a type of electrophoresis called SDS-PAGE (SDS-polyacrylamide gel electrophoresis) to separate mixtures of embryo proteins. We will use a combination of a detergent and heat to extract and denature proteins in present in zebrafish embryo. The detergent, sodium dodecyl sulfate (SDS), coats dissolved proteins and polypeptides with negative charges. The SDS-coated proteins can then migrate toward the positive electrode, but at different rates depending on their relative sizes. When proteins are coated with SDS and heated, they lose their three-dimensional structure and take on a net negative charge. Bigger polypeptides are coated with more molecules of SDS, so the ratio of a protein’s molecular weight to its charge is approximately the same for all proteins. This means that size (molecular weight) becomes the determinant of mobility through the gel.
As you know, many large, multimeric proteins are made up of smaller protein subunits. These polypeptides are held together by a number of bonds, including bonds between sulfur atoms in the amino acids they contain. Certain treatments (heat, SDS) can be used to break these disulfide bridges and release the separate polypeptide units. Thus, one functional, native protein can give rise to several smaller polypeptides. Myosin, for example, is a complex of 2 heavy protein chains and 4 light chains. The light chains are of two different sizes, so a purified myosin sample will form 3 separate bands when treated appropriately prior to electrophoresis.
You should be familiar with the use of agarose gels in horizontal gel chambers to perform electrophoretic separation of nucleic acids. SDS-PAGE procedures use SDS-PAGE gels that are run in vertical electrophoresis chambers. In these systems, a polyacrylamide gel is positioned in a buffer-filled chamber between two electrodes, treated protein samples are placed in wells at the top of the gel, and the electrodes are connected to a power supply that generates a voltage gradient across the gel. The negatively charged, SDS-coated proteins are then able to migrate downward through he gel toward the positive electrode. Protein size is measured in daltons, a measure of molecular weight. One dalton is defined as the mass of a hydrogen atom, which is 1.66 x 10⁻²⁴ gram. Most proteins have masses on the order of thousands of daltons, so the term kilodalton (kD) is often used to describe protein molecular weight. Given that the average weight of an amino acid is 110 daltons, the number of amino acids in a protein can be approximated from its molecular weight. • Average amino acid = 110 daltons
Proteins in your samples are not visible while the gel is running, unless they are prestained with covalently attached dyes. Our samples of embryo proteins will not be stained, but the protein standards (Kaleidoscope standards) that we will also be loading into a separate well, do have dye molecules attached to their proteins. Thus during electrophoresis, we should be able to see the separation of the protein standards, but not the proteins from our embryo extracts. As in any electrophoresis procedure, if the electric current is left on for too long, the proteins will run off the gel at the bottom. To avoid this, a blue tracking dye is mixed with the protein samples from the embryos. This blue dye is negatively charged and is also drawn toward the positive electrode. Since the dye molecules are smaller than the proteins expected in most samples, they move more quickly through the gel.
II. Objectives1. To observe normal development of zebrafish embryos (with luck…..)2. To isolate proteins from whole zebrafish embryos3. To become familiar with SDS-PAGE electrophoresis of proteins4. To perform SDS-PAGE electrophoresis of embryo protein mixtures5. To generate a standard curve using know protein molecular weight markers6. To look for the first expression of muscle protein in zebrafish embryosIII. ProceduresA. Normal Development of ZebrafishIf our zebrafish colony is working properly, we should have a supply of live, cleavage-stage zebrafish embryos available for observation. Using a dissecting scope you should make observations and drawings of your embryos over a 4-day period. During this time, the embryo goes from a single cell to a hatched, swimming larvae.There is also a good website of some timelapse photos of zebrafish development to be found at: http://www.luc.edu/depts/biology/dev/zebra.mov. In addition, I have some timelapse images that I have made of the development of this useful model organism. With luck, I should have a variety of live and preserved zebrafish embryos at different stages of development.B. Isolation of Proteins from Zebrafish embryosHere is an overview of this part of the experiment: we will be extracting the proteins from embryos, loading the protein extract into the SDS-PAGE gels, applying the electric current to the gels, removing the gels and staining them to visualize the protein bands, and then observing the differences in protein banding patterns from the different stage embryos.These differences in banding patterns of proteins represent different patterns of gene expression. The first part of this process involves the isolation of proteins from the embryos. Below is an outline of the procedure:1. The
procedure we will use uses whole embryos with their chorion or whole larval
stage fish. Transfer embryos into 1.5 ml microfuge tubes with stage of
development maked on tube). Remove as much water as possible with a pipette. 2. Add cold SDS sample buffer. Several forms of SDS sample buffer are available. For this lab we will be using premixed form of the SDS sample buffer called Laemmli sample buffer. To
maintain a concentrated mixture of proteins you should only add 1 µl of buffer
per embryo. For example, if you have 10 embryos, add 10 ul of SDS sample buffer.
You may need to adjust the final volume of sample buffer to about 30 ul if you
have less than 15 embryos.
A second protocol can be used for samples of relatively pure muscle tissue from adult fish (optional). 1. Use Sharpie to label 1.5 ml flip-top microtubes with the stage of development of the embryos or the adult fish to be analyzed. There should be one labeled tube for each sample being prepared or electrophoresis. 2. Add 250 µl of Laemmli Sample Buffer to each labeled tube, then add a piece of fish muscle (avoid skin, fat, and bones) approximately 0.25 x 0.25 x 0.25 cm3, to the appropriately labeled microtube. 3. Close the lid and gently flick the microtube 15 times with your finger to agitate the tissue in the sample buffer. 5. Allow the sample to incubate for 5 minutes at room temperature to extract and solubilize the proteins. 6. Obtain the supernatant and the actin and myosin standards and heat in hotblock for 5 minutes. 7. Obtain aliquots of the Kaleidoscope (KS) and actin and myosin (AM) standards. 8. Store the samples at room temperature if they are to be loaded onto gels within 3–4 hours, or store them at –70°C for up to several weeks.
C. SDS-PAGE Gel Electrophoresis of Protein Samples So far you have extracted, denatured, and given the proteins a negative charge. Now they can be separated according to their molecular weights using gel electrophoresis. Procedure Overview: I. Reheat embryo and actin and myosin standard controls (if necessary) II. Set up electrophoresis gel boxes III. Load and run gels IV. Stain gels to visualize protein bands 1. Reheat frozen samples at 95°C for 2–5 minutes to redissolve any precipitated detergent. 2. Obtain a precast gel, electrophoresis buffer, vertical electrophoresis chamber, and following the demonstration, assemble the electrophoresis chamber with gel and buffer. The precast gels are expensive and fragile, please handle with care. It is a good idea to wear gloves and use all safety precautions when handling precast PAGEr Gels. Here is the procedure: A. Cut open the pouch and remove the gel cassette and rinse with distilled or deionized water. B. Peel the tape off the bottom of the cassette. C. Gently pull out the comb and place it aside so it can be used to separate the cassette plates at the end of the run. E. Mount the cassette(s) into the electrophoresis apparatus so the printed side faces the outer (anode) buffer chamber. If running only one gel, mount an appropriate buffer dam. F. Fill the buffer chambers with appropriate amounts of Tris-glycine electrophoresis buffer. G. Rinse wells with Tris-glycine electrophoresis buffer.
3. Load samples into the wells. Our 10 well-gels can hold up to 30 ul. For best results, load Laemmli sample buffer in wells without samples. 4. It is very important to assign samples to specific wells, if you don’t know what stage of development is in which well, you will not be able to interpret your results. Record the well assignments in your lab notebook. If possible, try loading samples in middle of the gel, where separation is best with the standards on each side. For example, for 5 samples on a 10 well gel, you may choose to follow this guide: Lane Volume Sample 1 empty None 2 empty None 3 10 µl Kaleidoscope prestained standard (KS) (50ul) 4 10 µl Embryo sample 1 5 10 µl Embryo sample 2 6 10 µl Embryo sample 3 7 10 µl Embryo sample 4 8 10 µl Actin and myosin standard (AM) (50ul) 9 empty None 10 empty None To load each sample, use a thin, gel loading micropipet tip to withdraw 10-20 µl of each protein sample from its tube and gently transfer it into the designated gel well. After loading all samples, remove the sample loading guide (if available), place the lid on the tank, and insert the leads into the power supply, matching red to red and black to black. Set the voltage to 150 V and run the gels for 60 minutes or until tracking dye reaches the end of the gel. 4. Run gels at constant voltage at 125v to 200v for Tris-Glycine Buffer. When the dye front nears the bottom of the gel(s), the run is complete. Shut power off and disconnect the leads. Remove the lid and pour out the running buffer from the electrode assembly. Open the cams and remove the gel cassettes. 5. Hold the cassette in one hand and use the comb to separate the plates as follows: A. Crack open cassette sides by inserting the comb tip into each of the notches around the cassette and twisting firmly. Starting with the notches at the top, move down each side of the cassette. B. After the sides are open, place the comb’s slanted edge at a 45-degree angle between the plates at each bottom corner and twist firmly, then gently separate the two cassettes 6. The gel will adhere to either the short or long plate. Hold the plate with the gel over an open container. If the gel is adhered to the larger plate carefully insert thumb nail or a flat edged device (such as the comb teeth) through the plates slot and gently push out the bottom of the gel; allow the gel to peel away and gently drop into the container. If the gel is adhered to the smaller plate, carefully use the comb or a spatula to loosen one lower corner of the gel; allow the gel to peel away and gently drop into the container. NOTE: For best results, before removing the gel from the plate, remove well area and bottom lip of gel using a sharp spatula or razor blade. Use a chopping, straight up and down motion to prevent tearing the gel. 7. To keep the gel free of contamination from your fingertips, wear gloves to handle the gels from this point on. Lay a gel cassette flat on the bench and transfer the plate with the gel adhering to it to a tray containing e-pure water. Normally allow the liquid to detach the gel from the plate, but the gel may also be lifted directly (and gently!) from the plate and placed into the water wash solution. Rinse 3X for 5 minutes in e-pure water.
*8. Remove all the water and replace with 50 ml of Bio-Safe Coomassie Blue stain (or enough to completely cover gel). This is a common point to stop the first lab module. 9. Allow the gels to stain for 1 hour, with shaking if available. After one hour of staining, discard the stain and replace it with a large volume of water to destain. Allow to destain for 1 hour, then change the water and allow the gel to destain overnight. Another option is to stain all week, then destain right before the next lab. After destaining, distinct blue bands appear on the gel, each band representing on the order of 1012 molecules of a particular protein that have migrated to that position. The larger the amount of protein, the more intense the blue staining. 10. Finally, the destained gels must be dried. Keep your gels, all data analysis depends on the bands present. We will use the GelAir drying system includes 2 complete drying frames, which are made of a durable, molded plastic base with a stainless-steel top frame. The GelAir drying frames may be added to or removed from the GelAir dryer at any time while it is running. Each frame holds 4 mini gels or one 20 x 20 cm gel. When the dryer is fully loaded, 4 large gels or 16 mini gels can be dried at once.
Interpretation of Individual Bands: 1. What do the relative positions of the bands on the gel indicate about the proteins in the bands? 2. Are all of the bands of equal thickness? 3. How would you explain the observation that some proteins form thin bands while others form thick bands?
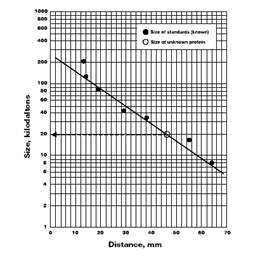
IV. Construct Your Own Standard Curve To determine the molecular weights of unknown proteins, construct a standard curve by plotting the molecular weights of known protein markers on the y-axis against the migration distances of those markers on the x-axis. Representing the molecular weights on a logarithmic scale results in a linear (straight) standard curve. From the standard curve, the molecular weight of an unknown protein can be estimated. First, measure the migration distance of a protein band from the bottom of the well to the lower edge of the band. Find the value for this migration distance on the x-axis of the standard curve and draw a vertical line up to the standard curve. Then draw a horizontal line from that point on the curve to the y-axis. The point where this line intersects the y-axis will give the value of the protein's apparent molecular weight. If there is time, your instructor may have you generate standard curves with SigmaPlot.
1. Construct a standard curve for your gel, using the Kaleidoscope standards’ migration distances and their known molecular weights below : 37 kd 25 kd 20 kd 15 kd 10 kd 2. Now use the standard curve to determine the molecular weights of actin and myosin in your control lane. 3. In your own embryo extracts, are there protein bands that migrated to identical positions as actin and myosin in the control lane? 4. Describe the relative concentrations of actin and myosin in your samples. 5. If possible, describe the relative concentrations of some of the proteins in your samples. 6. Do all of your samples have similar band profiles? How can you explain the variation in the muscle protein profiles of different stages of development? 7. Based on these molecular weights provided below, can you guess the identities of any of the proteins in your gel? Below is a list of proteins associated with muscle tissue: titin 3000 centers myosin in sarcomere dystrophin 400 anchoring to plasma membrane filamin 270 cross-links actin filaments into gel myosin heavy chain 210 slides actin filaments spectrin 265 attaches actin filaments to plasma membrane M1/M2 190 myosin breakdown product M3 150 myosin breakdown product C protein 140 myosin breakdown product nebulin 107 regulates actin assembly alpha-actinin 100 bundles actin filaments gelsolin 90 fragments actin filaments fimbrin 68 bundles actin filaments actin 42 forms filaments tropomyosin 35 strengthens actin filaments troponin (T) 30 regulates contraction myosin light chains 24, 17, 15 slides actin filaments troponin (I) 19 regulates contraction troponin (C) 17 regulates contraction thymosin 5 actin monomers
V. Materials: Small, clean 10 ml beakers 500 ml of 10% Hanks buffer solution 1.5 ml fliptop micro test tubes and racks 1.5 ml screwcap micro test tube Fish samples (5–8 types) 1 gm each (optional) Fine-point Sharpie marking pens Pasture pipettes with bulbs Eppendorf pippetors and tips for loading samples (0.5- 0 ul and 10-100 ul sizes) Hotblock set to 95°C Frozen zebrafish embryos at various stages of development Owl vertical electrophoresis chambers Electrophoresis power supplies Precast Cambrex PAGEr SDS-PAGE electrophoresis gels** e-pure water - 4 liters Gloves, safety glasses Gel drying oven and racks Shaker table for staining gels Microfuge pestles Dissecting scopes and light sources 3+ liters or epure water Squirt bottles with epure water Laemmli SDS sample buffer* Kaleidoscope prestained standards* Actin and myosin standards* (rehydrate with 500 uo of Lamelli sample buffer) Disposable 1 ml pipet (DPTP s)* Gel staining trays* Coomassie Stain for proteins* Tris-glycine-SDS electrophoresis buffer* * Included in Bio-Rad 66-0100EDU Kit **Cambrex Bio Science Rockland, Inc. www.cambrex.com/bioproducts biotechserv@cambrex.com Orders: 800-638-8174 Technical Service: 800-521-0390 PAGEr® Precast Gels should be stored at 2°C-8°C. Do not freeze. If Laemmli buffer is not available SDS sample buffer can be made up as follows: . 63 mM Tris-HCl pH 6.8, 10% glycerol, 5% ß-mercaptoethanol, 3.5% SDS. Store at -20°C in aliquots
VI. References: Davies PL and Hew CL, Biochemistry of Fish Antifreeze Proteins, FASEB J 4, 2460-2468 (1990) Glausiusz J, The Old Fish of the Sea, Discover 20, 49 (1999) International Human Genome Sequencing Consortium, Initial Sequencing and Analysis of the Human Genome, Nature 409, 860-921 (2001) Jasny BR and Kennedy D, The Human Genome, Science 291, 1153 (2001) Laemmli UK, Cleavage of Structural Proteins during the Assembly of the Head of Bacteriophage T4, Nature 227, 680-685 (1970) Piñeiro C et al., Development of a Sodium Dodecyl Sulfate-Polyacrylamide Gel Electrophoresis Reference Method for the Analysis and Identification of Fish Species in Raw and Heat-Processed Samples: A Collaborative Study, Electrophoresis 20, 1425-1432 (1999) Ridley M, Genome, Fourth Estate Limited, London, (1999)
Westerfield, M. The Zebrafish Book:
A guide for the laboratory use of zebrafish Danio (Brachydanio) rerio
| ||||||||||||