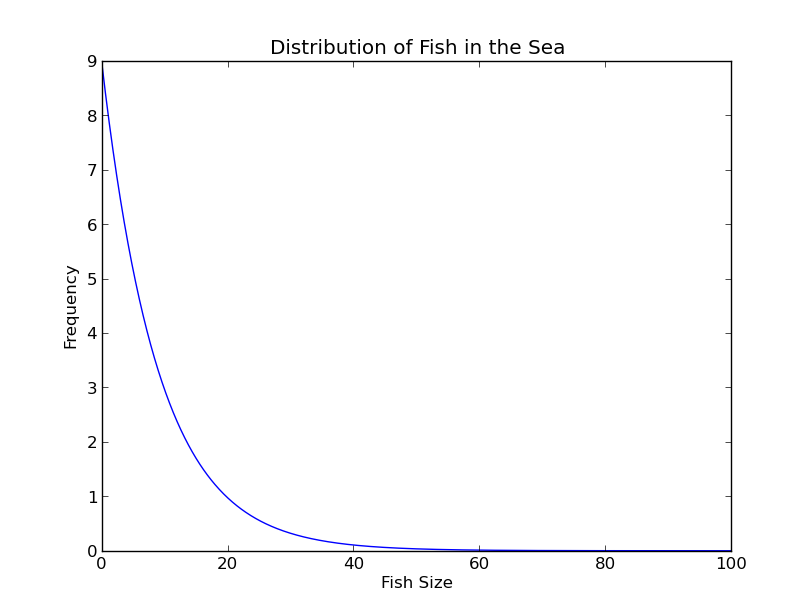
Smaller fish are much more common than larger fish. This is reflected in the distribution of fish. It looks like this (definitely not a bell curve!):
The population of fish has the following parameters.
If I catch a sample of 20 fish, randomly selected, my sample will probably reflect the true population distribution. Here are the weights (in lbs.) of the fish I caught:
0.69, 1.53, 2.07, 2.17, 2.31, 2.70, 3.03, 4.25, 5.51, 5.99, 6.96, 8.38, 9.18, 10.32, 12.12, 12.74, 14.39, 20.40, 21.11, 22.27
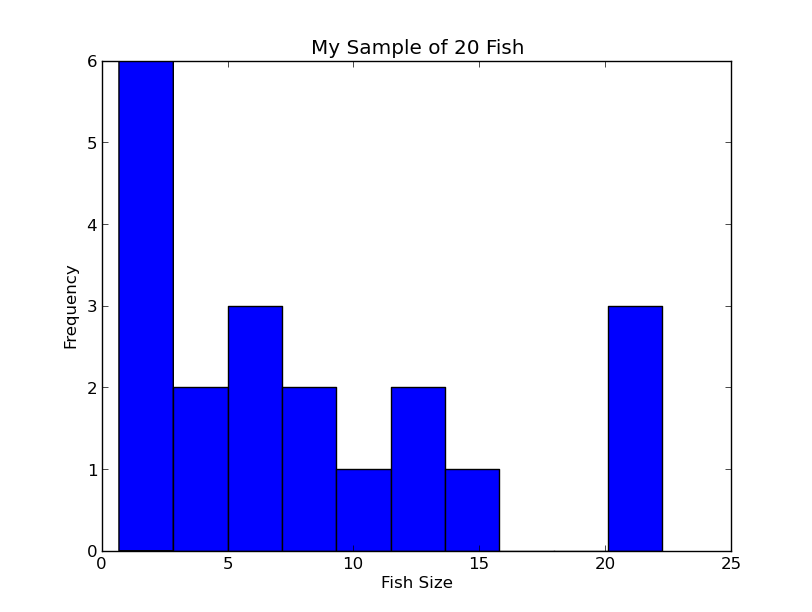
My sample of fish has the following statistics.
What is the 95% confidence interval for $\mu$?
Does the confidence interval contain the true population mean?
Why can we use a tool (confidence intervals) that relies on bell curves to analyze a population that definitely does not have a bell shaped distribution?