plot of chunk GradeInfo1
library(ggplot2)
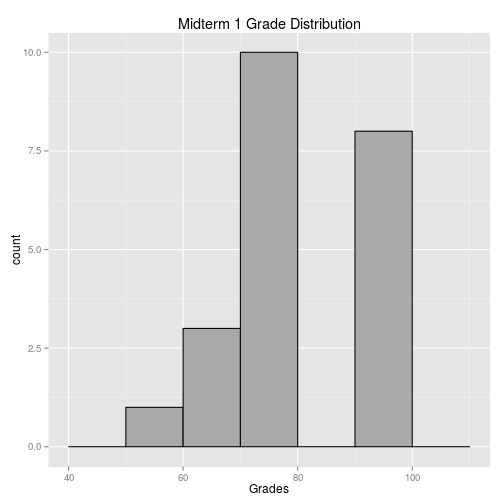
Grades <- c(53, 62, 68, 68, 71, 71, 72, 72, 72, 75, 75, 76, 76, 79, 90, 91,
92, 92, 92, 93, 94, 96)
summary(Grades)## Min. 1st Qu. Median Mean 3rd Qu. Max.
## 53.0 71.2 75.5 78.6 91.8 96.0c <- qplot(Grades, main = "Midterm 1 Grade Distribution", binwidth = 10)
c + geom_histogram(fill = "darkgray", color = "black", binwidth = 10)plot of chunk GradeInfo1
| Problem | Concept | Class Average |
|---|---|---|
| 1 | Unit vectors (video) | 53.79% |
| 2 | Vector equation for a line | 89.39% |
| 3 | Area of a parallelogram | 85.80% |
| 4 | Polar coordinates | 85.80% |
| 5 | Slopes of parametric curves | 84.66% |
| 6 | Vector equation of a line | 83.52% |
| 7 | Normal vectors (video) | 72.73% |
| 8 | Vector equation for a plane (video) | 71.02% |
| 9 | Vector addition and subtraction | 88.07% |
| 10 | Area of a polar curve | 86.36% |
| 11 | Dot products and orthogonality | 62.12% |
| 12 | Vector notation | 78.41% |