Today we introduced conditional probabilities. We talked about the notation \(P( A \mid B )\) which means “The probability that A happens given that B happened.” We looked at several examples of conditional probabilities that were in last Friday’s workshop on two-way tables.
We also did this example in class where we looked at historical records from a smallpox outbreak in Boston in 1721. The data looked at survival outcomes for smallpox patients versus whether they had been inoculated. Here is a two way table with the results:
| Inoculated | Not Inoculated | |
|---|---|---|
| Survived | 238 | 5136 |
| Died | 6 | 844 |
| Total | 244 | 5980 |
We answered the following questions about this table.
Find P(Survived|Inoculated)
Find P(Survived|Not Inoculated)
How many times more likely were people to survive if they were inoculated?
What are the explanatory & response variables here?
Why can’t we say that inoculation was definitely the cause of the lower risk of dying?
Today we introduced weighted tree diagrams. To draw a weighted tree diagram, follow these four rules:
Draw branches that end out outcomes.
Use the probabilities as the weights on the branches.
Multiply probabilities along branches.
Add probabilities from separate branches.
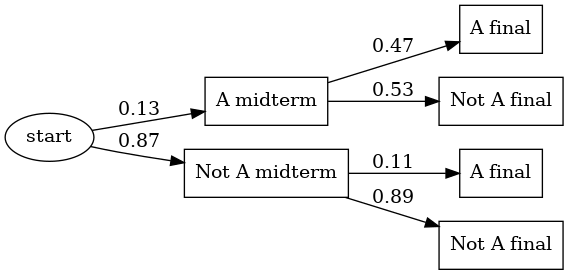
We did this example in class. Suppose that 13% of students in a class get an A on the midterm exam. Of those, 47% also got an A on the final exam. Also, 11% of students who didn’t get an A on the midterm pulled up their grade and got an A on the final exam. The tree diagram for this situation is as follows.
From this you can calculate the following:
We also talked about the Conditional Probability Formula \[P(A \mid B) = \frac{P(A \text{ and } B)}{P(B)}.\]
We used this formula to answer the following question.
We did this workshop in class:
Today we talked about the birthday problem and about the binomial distribution which is the probability model when you flip a fair or unfair coin with a probability of landing on heads equal to p and count the total number of heads after N flips.