Math 242 - Fall 2014
Wednesday, Nov 12
- Monte Carlo computations for integrals (SageCell)
Thursday, Oct 30
- Additional Exercise 1 from Homework (SageCell)
Wednesday, Oct 29
Monday, Oct 20
Monday, Oct 6
- Wilson trail topographic map (html)
- Contour plots with sage (html)
Friday, Oct 3
- Graphing the parametric curve with its tangent line from exercise 3 in 1.8 (html)
Tuesday, Sept 30
- Parametric Curves in Sage (html)
- Plotting Surfaces in Sage (html)
Wednesday, Sept 17
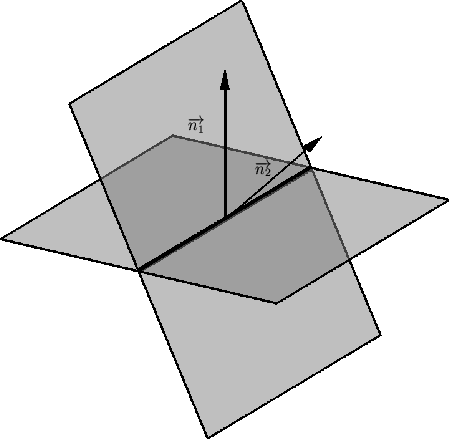
- Two Planes Intersecting (png)
Friday, Sept 12
- Cross-Product Animation (gif)
Wednesday, Sept 10
Thursday, Sept 4
To put multiple graphs in the same picture, connect the plot commands with a + sign.
Monday, Sept 1
The command to graph a polar coordinate function \(r = f(\theta)\) using Sage is polar_plot(). Here is an example.
Friday, Aug 29
Thursday, Aug 28
Wednesday, Aug 27
The command to create a 2-dimensional parametric plot in Sage is parametric_plot(). Here is an example of how to use the command.